Earth Science worksheet
    Topic: Solar System Data
    Solar System Data
    Base your answers to questions 1 on the diagram below, which represents the current locations of two planets, A and B, orbiting a star. Letter X indicates a position in the orbit of planet A. Numbers 1 through4 indicate positions in the orbit of planet B.

    seasons-and-astronomy, the-solar-system, standard-6-interconnectedness, models fig: esci62012-exam_w_g56.png

    1

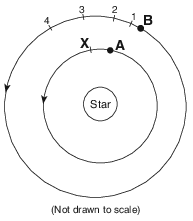
    If the diagram represents our solar system and planet B is Venus, which planet is represented by planet A?

    (1) Mercury

    (2) Jupiter

    (3) Earth

    (4) Mars

    2

    The universe is approximately 13.8 billion years old. Compared to the age of the solar system, the age of the universe is approximately

    (1) the same age as the solar system

    (2) two times older than the solar system

    (3) three times older than the solar system

    (4) four times older than the solar system

    3

    Which motion occurs at a rate of approximately one degree per day?

    (1) the Moon revolving around Earth

    (2) the Moon rotating on its axis

    (3) Earth revolving around the Sun

    (4) Earth rotating on its axis

    Base your answers to questions 4 on the diagrams below. The diagrams represent the events that occur when a large meteor, such as the one believed to have caused the extinction of many organisms, impacts Earth’s surface. Diagram A shows the meteor just before impact. Diagram B represents the crater forming, along with the vapor and ejecta (the fragmented rock and dust) thrown into the atmosphere.

    seasons-and-astronomy, asteroids-comets-and-meteors, earth-history, standard-1-math-and-science-inquery, geocentric-model-heliocentric-model, standard-6-interconnectedness, models fig: esci62012-exam_w_g40.png

    4

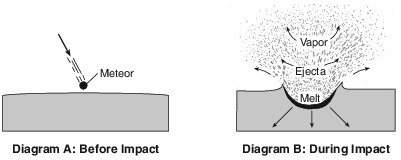
    Many meteors are believed to be fragments of celestial objects normally found between the orbits of Mars and Jupiter. These objects are classified as

    (1) stars

    (2) asteroids

    (3) planets

    (4) moons

    5

    The diagram below compares the relative diameters of two planets in our solar system.

    reference-tables, solar-system-data, seasons-and-astronomy, the-solar-system, standard-1-math-and-science-inquery, changing-length-of-a-shadow-based-on-the-motion-of-the-sun, standard-6-interconnectedness, models fig: esci12020-examw_g1.png

    Which two planets have diameters that most closely resemble this comparison?

    (1) Uranus and Neptune

    (2) Jupiter and Saturn

    (3) Earth and Mars

    (4) Mercury and Venus

    6

    The terrestrial planets differ from the Jovian planets because the terrestrial planets are

    (1) less dense and larger

    (2) less dense and smaller

    (3) more dense and larger

    (4) more dense and smaller

    7

    Compared to terrestrial planets, Jovian planets have

    (1) smaller equatorial diameters and shorter periods of revolution

    (2) smaller equatorial diameters and longer periods of revolution

    (3) larger equatorial diameters and shorter periods of revolution

    (4) larger equatorial diameters and longer periods of revolution

    Base your answers to questions 8 on the graph below and on your knowledge of Earth science. The graph shows the closest distance between Earth and Mars during each year from 2001 to 2035. Distances are measured in astronomical units (AU). One AU equals the average distance from Earth to the Sun.

    seasons-and-astronomy, the-solar-system, standard-1-math-and-science-inquery, velocity-slope-sediment-size-channel-shape-stream-valume-distance-from-the-sun-gravitational-force-period-of-revolution-speed-of-revolution, standard-6-interconnectedness, patterns-of-change fig: esci12018-examw_g36.png

    8

    How many million kilometers is one astronomical unit?

    (1) 108.2 million km

    (2) 149.6 million km

    (3) 227.9 million km

    (4) 377.5 million km

    9

    Planets that are closest to the Sun are identified as

    (1) low-density Jovian

    (2) low-density terrestrial

    (3) high-density Jovian

    (4) high-density terrestrial

    Base your answers to questions 10 on the diagram below and on your knowledge of Earth science. The diagram represents a planetary system, discovered in 2013, with seven exoplanets (planets that orbit a star other than our Sun) labeled b through h orbiting a star. The exoplanet orbits are represented with solid lines. For comparison, the orbits of three planets of our solar system are shown with dashed lines. The sizes of the star, exoplanets, and planets are not drawn to scale.

    seasons-and-astronomy, the-solar-system, standard-6-interconnectedness, models fig: esci62017-exampwr_g36.png

    10

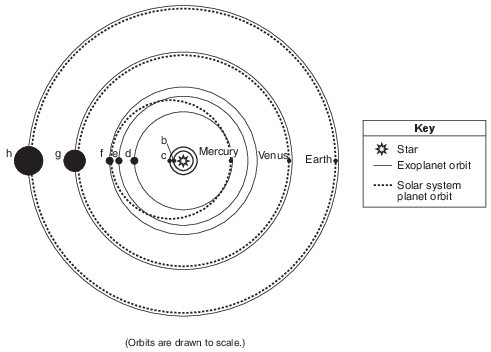
    In image below, circle the type of planet (terrestrial or Jovian) to indicate the classification of the three solar system planets shown in the diagram. Describe one characteristic of this type of planet that distinguishes it from the other type of planet. [1]

    Circle one: terrestrial planet Jovian planet Characteristic of this type of planet:

    Allow 1 credit if both terrestrial planet is circled and an acceptable characteristic is described.. Acceptable responses include, but are not limited to:

    • — smaller diameter than Jovian

    • — higher density

    • — Terrestrial planet densities range from 3.9 g/cm3 to 5.5 g/cm3.

    • — rocky/solid

    • — not gaseous

    • — closer to the Sun

    • — less mass

    • — shorter period of revolution

    • — longer periods of rotation

    • — Terrestrial planets don’t have rings.
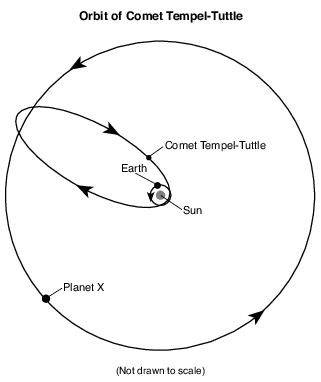
    Base your answers to questions 11 on the diagram and passage below and on your knowledge of Earth science. The diagram represents the orbits of Earth, Comet Tempel-Tuttle, and planet X, another planet in our solar system. Arrows on each orbit represent the direction of movement.

    seasons-and-astronomy, asteroids-comets-and-meteors, seasons-and-astronomy, the-solar-system, standard-1-math-and-science-inquery, geocentric-model-heliocentric-model fig: esci62019-examw_g39.png

    Comet Tempel-Tuttle

    Comet Tempel-Tuttle orbits our Sun and is responsible for the Leonid meteor shower event observed from Earth. This meteor shower occurs every year in November and is visible in the night sky as Earth passes through the debris left in space by this comet. The debris from the comet produces meteors that are smaller than a grain of sand, which enter Earth’s atmosphere and burn up in the mesosphere temperature zone. Comet Tempel-Tuttle’s orbital distance from the Sun ranges from about 145 million kilometers at its closest approach to 2900 million kilometers at its farthest distance. Its two most recent closest approaches to the Sun occurred in 1965 and one revolution later in 1998.

    11

    Identify the solar system planet represented by planet X, which orbits near Comet Tempel-Tuttle’s farthest distance from the Sun. [1]

    Allow 1 credit for Uranus.

    Base your answers to questions 12 on the diagram in image provided and on your knowledge of Earth science. The diagram represents the Moon’s orbit around Earth as viewed from space above Earth’s North Pole (NP). Letter A represents one position of the Moon in its orbit.
    12

    Describe the actual shape of the Moon’s orbit. [1]

    Allow 1 credit. Acceptable responses include, but are not limited to:

    • — The Moon’s orbit has an elliptical shape.

    • — slightly eccentric

    • — almost a circle/nearly circular

    • — oval

    • — has an eccentricity of 0.055

    • Note: Do not allow credit for “circle” or “circular” alone because the eccentricity of the Moon’s

    • orbit is not zero.

    Base your answers to questions 13 on the geologic timeline below and on your knowledge of Earth science. The geologic timeline, drawn to scale, represents Earth’s geologic history. The letters A through H on the timeline represent the times of occurrence for specific, labeled geologic events. The time of occurrence for letter A has been omitted.

    geologic-history, reference-tables, earth-history, evolution-of-life-forms-and-the-free-oxygen-in-the-atmosphere, standard-1-math-and-science-inquery, changing-length-of-a-shadow-based-on-the-motion-of-the-sun, standard-6-interconnectedness, models fig: esci12017-examw_g32.png

    13

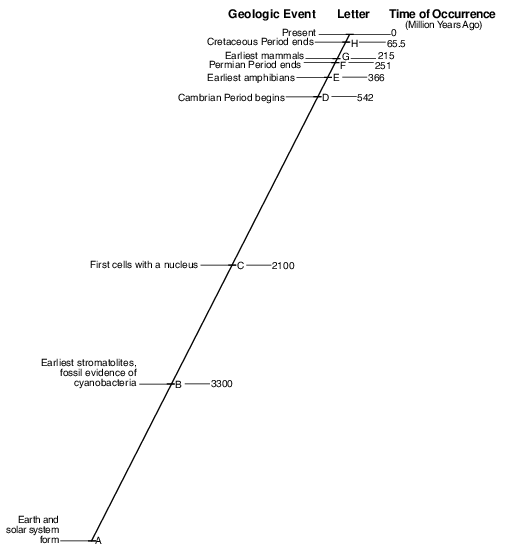
    State the time of occurrence for the geologic event labeled A on the geologic timeline. [1]

    ______________ million years ago

    Allow 1 credit. Acceptable responses include, but are not limited to:

    • — 4600 million years ago

    • — 4.6 × 10³ million years ago

    • Note: If the student crosses out million years ago, allow credit if an equivalent value is expressed

    • in other units (e.g., 4.6 billion years ago).

    Base your answers to questions 14 on the geologic cross section below, which represents a portion of Earth’s crust. Some rock units contain index fossils. Box A indicates a missing portion of the cross section.

    earth-history, earth-history, relative-age-and-sequence-of-rock-strata, standard-6-interconnectedness, models fig: esci62012-exam_w_g62.png

    14

    The meteor impact debris was deposited at the time trilobites became extinct. State the age, in million years, of this debris layer. [1]

    million years

    Allow 1 credit for 251 million years.

    Base your answers to questions 15 on the graph in image provided and on your knowledge of Earth science. The graph shows planet equatorial diameters and planet mean distances from the Sun. Neptune is not shown.
    15

    In image below, place an X on the graph to indicate where Neptune would be plotted, based on its mean distance from the Sun and its equatorial diameter. [1]

    reference-tables, solar-system-data, seasons-and-astronomy, the-solar-system, standard-1-math-and-science-inquery, eccentricity-rate-gradient-standard-error, standard-1-math-and-science-inquery, geocentric-model-heliocentric-model, standard-1-math-and-science-inquery, changing-length-of-a-shadow-based-on-the-motion-of-the-sun fig: esci82015-ansbkt_abkq2.png

    Allow 1 credit if the center of the X for Neptune is plotted within or touches the grid square that is circled as shown below.

    • Note: Allow credit if a symbol other than an X is used. Neptune need not be labeled.

    reference-tables, solar-system-data, seasons-and-astronomy, the-solar-system, standard-1-math-and-science-inquery, eccentricity-rate-gradient-standard-error, standard-1-math-and-science-inquery, geocentric-model-heliocentric-model, standard-1-math-and-science-inquery, changing-length-of-a-shadow-based-on-the-motion-of-the-sun fig: esci82015-rg_g2.png